ACT Score Chart
This ACT score chart shows exactly how many questions you need to answer correctly in each section to reach a given scaled score, from 1 up to 36. Use it alongside the ACT score calculator to check both your raw numbers and your final composite in one place.
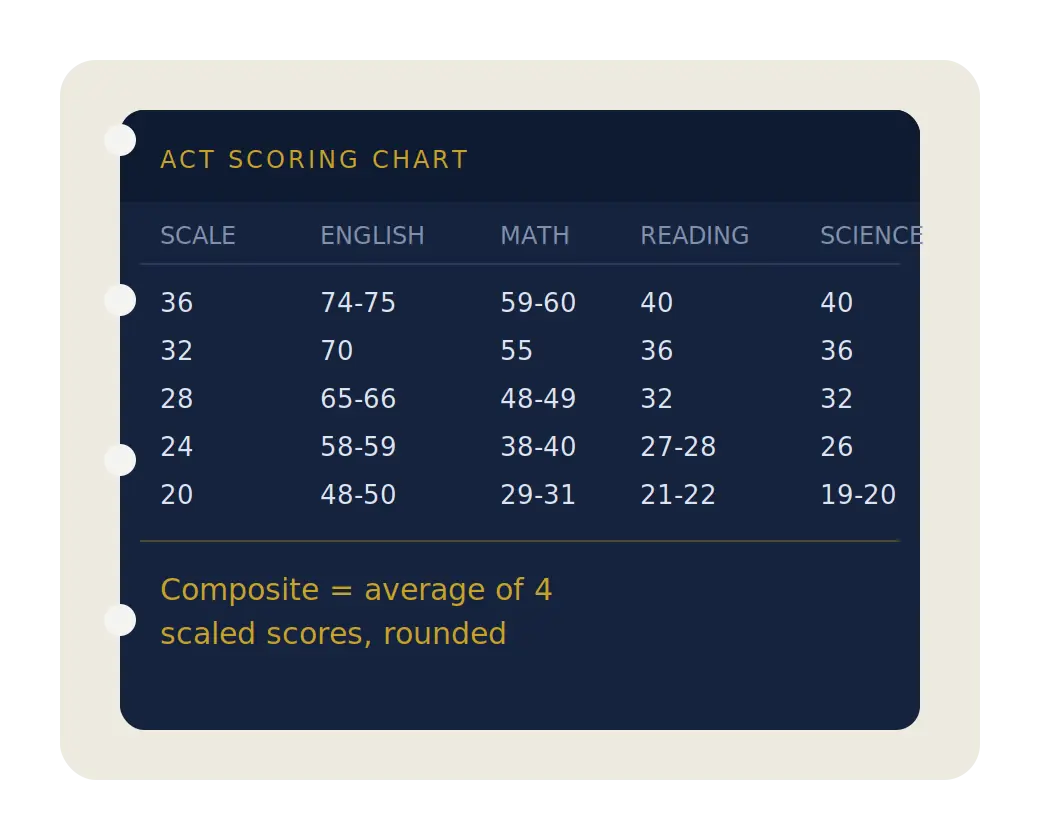
The Full ACT Score Chart, Section by Section
The table below is a typical ACT score chart built from the curves used across many past test forms. Find your raw score, the number of questions you answered correctly, in the column for that section, then read across to see the scaled score it lines up with on any given row.
| Scale | English (of 75) | Math (of 60) | Reading (of 40) | Science (of 40) |
|---|---|---|---|---|
| 36 | 74-75 | 59-60 | 40 | 40 |
| 35 | 73 | 58 | 39 | 39 |
| 34 | 72 | 57 | 38 | 38 |
| 33 | 71 | 56 | 37 | 37 |
| 32 | 70 | 55 | 36 | 36 |
| 31 | 69 | 54 | 35 | 35 |
| 30 | 68 | 52-53 | 34 | 34 |
| 29 | 67 | 50-51 | 33 | 33 |
| 28 | 65-66 | 48-49 | 32 | 32 |
| 27 | 64 | 46-47 | 31 | 30-31 |
| 26 | 62-63 | 43-45 | 30 | 29 |
| 25 | 60-61 | 41-42 | 29 | 27-28 |
| 24 | 58-59 | 38-40 | 27-28 | 26 |
| 23 | 56-57 | 36-37 | 26 | 24-25 |
| 22 | 54-55 | 34-35 | 24-25 | 23 |
| 21 | 51-53 | 32-33 | 23 | 21-22 |
| 20 | 48-50 | 29-31 | 21-22 | 19-20 |
| 19 | 45-47 | 27-28 | 19-20 | 17-18 |
| 18 | 42-44 | 24-26 | 18 | 15-16 |
| 17 | 40-41 | 21-23 | 16-17 | 13-14 |
| 16 | 37-39 | 18-20 | 14-15 | 11-12 |
| 15 | 34-36 | 15-17 | 12-13 | 9-10 |
| 14 | 31-33 | 12-14 | 10-11 | 8 |
| 13 | 28-30 | 9-11 | 8-9 | 6-7 |
| 12 | 24-27 | 7-8 | 7 | 5 |
| 11 | 21-23 | 5-6 | 6 | 4 |
| 10 | 18-20 | 4 | 5 | 3 |
| 9 | 16-17 | 3 | 4 | 3-2 |
| 8 | 13-15 | 2 | 3 | 2 |
| 7 | 10-12 | 2-1 | 3-2 | 2-1 |
| 6 | 8-9 | 1 | 2 | 1 |
| 5 | 6-7 | 1-0 | 2-1 | 1-0 |
| 4 | 4-5 | 1-0 | 1 | 1-0 |
| 3 | 3 | 0 | 1-0 | 1-0 |
| 2 | 2 | 0--1 | 1-0 | 1-0 |
| 1 | 0-1 | 0--1 | 0 | 0 |
Figures reflect a typical raw to scale curve. Your official ACT conversion chart for a specific test date may shift by a point or two per section.
How to Read an ACT Score Chart
Every ACT score chart works the same way underneath, even though the numbers shift slightly by test form. You start with your raw score, meaning how many of the multiple choice questions you got right in a section, out of 75 for English, 60 for Math, or 40 each for Reading and Science. There's no penalty for a wrong answer and no penalty for guessing, so your raw score is simply your total number correct.
That raw score gets mapped to a scaled score between 1 and 36 using the chart for that section. This is the step most students skip past without realizing how much it matters. Near the top of the chart, one or two missed questions can pull your scaled score down by a full point, because so few students reach the highest raw scores that each question carries more weight there.
In the middle of the chart, the curve flattens out, so missing three or four questions might only cost you a single scaled point, sometimes none at all. This is exactly why an ACT score chart is not a straight line from raw score to scaled score, and why guessing your score without checking the actual chart tends to be inaccurate at the high and low ends.
Once you have all four scaled scores, English, Math, Reading, and Science, your composite is the average of the four, rounded to the nearest whole number. A set of scaled scores like 32, 28, 33, and 31 averages to 31, which becomes your reported composite.
Why the ACT Conversion Chart Shifts by Test Date
Students often assume there's one fixed ACT conversion chart used for every test, but that's not quite how it works. Each test form is curved individually based on how the group of students taking that particular form performed overall.
If a certain Math section turns out to be a bit harder than usual, the raw score needed for a 30 might drop by a point compared with an easier form given on a different date. This is called equating, and it's meant to keep a 30 roughly equally difficult to earn no matter which date or which version of the test a student sat for.
Because of equating, the exact chart tied to your test isn't published in advance, and it arrives with your official score report rather than as a public document ahead of time.
The chart on this page reflects a typical curve pulled from many past test forms, which makes it a reliable planning tool, though your own scaled scores on test day could land a point higher or lower per section depending on that day's specific curve.

Using the Chart Section by Section
English
With 75 questions, English has the most room for small mistakes to matter less. Missing five or six questions in the low-30s range on this ACT scoring chart often costs less than a single scaled point, though the same number of misses near the top of the chart, in the low 70s, can cost two or three points.
Math
Math has only 60 questions, so each one carries more weight than an English question does. The curve on the Math section of most conversion charts tends to be a bit steeper in the middle range, meaning a handful of careless errors shows up more clearly in your scaled score than the same number of errors would on English.
Reading and Science
Both sections have 40 questions and similar curves, though Science often has a slightly steeper drop near the very top of the chart. Missing just one or two questions out of 40 on Science can sometimes mean the difference between a 36 and a 34, which is worth knowing if pacing across the seven passages tends to be your biggest challenge.
Want your composite calculated automatically?
Skip the manual lookup and enter your raw scores directly into the live ACT score calculator.
Common Questions About the ACT Score Chart
What is an ACT score chart?
An ACT score chart is a table that converts your raw score, the number of questions you got right in a section, into a scaled score between 1 and 36. Each of the four multiple choice sections has its own chart, and the four scaled scores are then averaged into your composite.
Why does the ACT conversion chart change between test dates?
Each test form is curved separately based on how that specific group of test takers performed, so the raw score needed for a given scaled score can shift by a point or two from one test date to the next. This process, called equating, keeps the difficulty of earning a given score roughly consistent across different test dates.
Is the Math section scored on the same scale as English?
Yes. Every section lands on the same 1 to 36 scale, even though the sections have a different number of questions. Math has 60 questions while English has 75, so a raw score of 50 means something quite different on each ACT score chart.
Does missing one question always cost the same number of scaled points?
No. Near the top of an ACT score chart, missing even one or two questions can drop you a full scaled point, while in the middle of the chart a few missed questions might not move your scaled score at all. The chart is not a straight line, which is exactly why looking up the real numbers matters more than assuming a flat point-per-question deduction.
Where can I find the official ACT scoring chart for my specific test?
The official chart tied to your exact test form isn't published publicly ahead of time. It arrives alongside your official score report after test day. The chart on this page reflects a typical curve seen across many past ACT test forms, which makes it useful for planning even though it won't match your specific form point for point.
Turning the Chart Into a Study Plan
A scoring chart is most useful once you stop treating it as a lookup table and start using it to set targets. If you're sitting at a 24 composite and want to reach a 27, look at where each section's scaled score currently falls on the chart, then check how many additional raw score points that section needs to move up.
Sections near the middle of the chart, where the curve is flatter, often need more raw score improvement per scaled point than sections near the top, where a couple of extra correct answers can swing your score noticeably.
This is also where a plain ACT scoring chart falls short on its own. It tells you what a raw score converts to, but it doesn't tell you which section is realistic to improve fastest. Pair the chart with the ACT score calculator after every practice test, track your raw scores by section over time, and you'll start to see which section responds best to focused practice rather than guessing based on the chart alone.
For more detail on how the underlying scoring process works, including the optional writing test and how colleges read your composite, see how ACT scoring works.